


Open a crash dashboard after a large playtest and the first thing you usually see is a list sorted by event count. The problem is that event count is not the same thing as engineering priority.
Over the last 12 months, AccelByte Development Toolkit (ADT) processed 11,000+ crash events from Unreal projects in development. The largest classification - Assertion / Check Failure - accounted for 9,733 of them, or 83.07%. If that were the crash queue waiting on Monday morning, the obvious move would be to start at top.
Once the data was split by environment and underlying issue, that ranking stopped looking like a priority list. Almost 86% of all recorded events came from Unreal Editor sessions. The dominant assertion category was heavily influenced by a recurring editor-startup signature. And the platform totals had no session or playtime denominator, so they could not be turned into crash-rate comparisons.
The useful question became: when thousands of crash reports are coming in, what information actually tells an engineering team what to fix first?
That is the problem this article works through. The dataset exposes where a frequency-first ranking breaks down, and the fields it does not contain are just as useful because they show what a crash pipeline needs to capture if the team wants a defensible priority order.
Where the Data Comes From
ADT supports build distribution, playtests, and development diagnostics. For this analysis, the relevant piece is ADT Crash Reporter: it groups related crash events into issues and keeps the build, platform, symbolicated stack, logs, session information, and available pre-crash context together for investigation.
Scope and privacy
Every crash in this analysis came from a game in development. The dataset contains no live-production crash events. Customer, studio, game, project, build-machine, developer, and user details have been anonymized or removed. The data is Unreal-focused and should not be read as an industry benchmark or as a picture of what players crash on after release.
Start with the Obvious Ranking - Then Stop Treating It as the Priority Order
Sorted by event count, the crash-pattern rollup looks decisive:
That table answers one useful question: which classification generated the most events in this development dataset? It does not answer which issue deserves engineering time first.
The assertion result is the clearest example. At 83.07%, it looks like the story of the dataset. A closer review of the underlying signatures showed that the category is heavily influenced by a recurring editor-startup assertion in the Unreal Content Browser path. That can still be a serious developer blocker, but it is a very different problem from a packaged-client regression or a dedicated-server crash.
In other words, the category occupying 83% of the chart could be important, but the chart itself gives you almost none of the information needed to know how important.
Frequency is the first view of the queue. Triage needs enough context to explain what that number actually represents.
Keep This Crash Queue in Mind While Reading the Rest
The following three issues are illustrative, not rows from the ADT export. They are deliberately simple so the priority changes are easy to see:
Sorted by event count, the order is A, B, C. The rest of the article explains why a real triage pass can legitimately end somewhere closer to C, B, A.
Separate Editor Crashes from the Builds You're Trying to Ship
The platform split changes the meaning of the entire top-five list. windows-editor-ue5 contributed 5,919 events and windows-editor another 4,131. Together, those two editor categories account for 10,050 events - 85.8% of the whole window.
Packaged and runtime labels - Windows, PS5, Xbox Series, Windows Server, Linux, and Linux Server - account for roughly 1,082 events, or 9.2%. Another 585 events have no platform attribution. Those packaged/runtime events are still development-build crashes; a PS5 label says where the development build ran, not that a live player crashed.
Most of the recorded crash volume came from editor sessions. That changes what the raw ranking is actually measuring.
That is why the first useful split in a crash queue is operational, not statistical:
-
Editor:
developer blockers, startup crashes, lost work, and failures reproduced across the team. -
Packaged client:
current-build regressions, QA blockers, certification risk, and crashes on the path the player build will eventually run. -
Dedicated server:
session impact and recurrence across server builds. -
Live:
player-facing stability kept separate from development traffic once live telemetry exists.
Return to the worked queue. Issue A owns the event-count leaderboard, but it is an editor issue. Issues B and C are now in different operational queues with different consequences. Frequency still matters; it just stopped being the only axis.
Group Events Before Assigning Work
The 11,717 crash events in the window were grouped into 4,000 distinct issues. An event is one occurrence. An issue is the thing an engineer can actually investigate: a group of events that appear to share the same underlying crash signature or fingerprint.
That distinction matters because a raw event stream can be dominated by repetition. Ten thousand events do not mean ten thousand bugs. A category can also look broad while one or a few signatures are doing most of the work underneath it.
The 2.9x event-to-issue average does not tell us how concentrated recurrence is, so it should not be treated as a quality or severity metric.
For prioritization, the issue row needs the grouping context beside the count: fingerprint, first seen, last seen, current build, builds affected, platforms affected, and privacy-safe affected-population breadth where available.
A Crash that Disappeared Three Builds Ago Isn't Today's Fire
A 12-month sort by event count naturally favors issues that have had months to accumulate events. That is useful for understanding persistent problems and a poor way to decide what changed in the candidate build distributed this morning.
In the worked example, Issue A has 1,800 events but has not appeared in the last three builds. Issue B has only 92 events, but all of them started in the current release candidate. If the goal is release readiness, B moves ahead of A before anyone opens a debugger.
The current export does not include enough issue-level first-seen, last-seen, and build-persistence data to calculate that ranking for the 4,000 real issues. That missing data is itself a useful requirement: if the team needs to answer "did this build regress?", recency and build introduction need to be first-class crash fields.
One Noisy Machine Can Distort the Queue
Event count says how many times something happened. It does not say how widely it happened. Consider two current packaged-client issues: one has 300 events on 2 machines; another has 80 events on 35 machines. The second may be the broader release risk even though it has fewer events.
That is the difference between recurrence and breadth. A narrow issue can be extremely repeatable in one environment while a lower-volume issue is spreading across the test population. Breadth gives the team a way to distinguish those two cases instead of letting repetition alone drive the queue.
The source export intentionally does not expose customer-identifying machine or user data, and the public report does not contain a privacy-safe affected-population measure. For a production triage system, that measure is worth keeping in aggregate form.
Crash Count Without Test Volume Isn't a Crash Rate
The packaged/runtime counts include 716 Windows events, 246 PS5, 79 Xbox Series, 33 Windows Server, 7 Linux, and 1 Linux Server. Those numbers tell you where reports came from. They do not tell you which platform is less stable.
The missing piece is exposure. A platform that ran far more sessions should usually produce more raw crashes even if it is more stable per session.
Illustrative rate comparison
Suppose Windows produced 716 crashes across 200,000 test sessions: 3.58 crashes per 1,000 sessions. Suppose PS5 produced 246 crashes across 20,000 sessions: 12.3 per 1,000. The raw count is lower on PS5, but the normalized crash rate is much higher. These session numbers are illustrative only; the ADT export does not provide them.
Useful denominators depend on the workflow: crashes per 1,000 sessions, crash-free session percentage, affected testers divided by active testers, or crashes per test hour. If there is no denominator, keep the metric labeled as a count. Do not let a volume chart quietly become a reliability claim.
Then Ask What One Occurrence Actually Costs
Frequency, recency, breadth, and exposure still do not tell the whole story. One occurrence can cost very different amounts depending on where it happens.
-
An editor crash during shutdown is irritating but may be easy to work around.
-
An editor crash on startup can block an entire discipline from opening the project.
-
A packaged-client crash in the first five minutes can stop QA from covering the build.
-
A dedicated-server crash can terminate an active match for everyone on that instance.
-
A live-client crash ends a real player session once live telemetry exists.
Now return to the worked queue one last time. Issue C has only 18 events, but it is a current dedicated-server crash reproduced across several instances. If each occurrence ends a match, it can reasonably outrank Issue B despite having one-fifth the event count. Issue A, still the loudest by historical volume, may now be third.
There is no universal score here. Teams need to make severity explicit enough that a server crash ending a match does not sit below a harmless high-volume editor shutdown crash simply because the latter happened more often.
The Same Queue After Triage
After environment, recency, breadth, and impact are visible, the illustrative queue no longer looks like A, B, C:
-
Issue C - current dedicated-server crash with match-level impact across several instances.
-
Issue B - widespread packaged-client regression first seen in the release candidate.
-
Issue A - historically noisy editor issue not seen in the last three builds.
The point is not that server issues always outrank client issues. The point is that the order is now based on current impact and breadth instead of which issue had the longest time to accumulate events.
The 83% Assertion Result Is What This Looks Like in Real Data
The raw rollup says Assertion / Check Failure is 83.07% of the dataset. The environment split says most of the overall dataset is editor traffic. The underlying signature review says the category is heavily influenced by a recurring editor-startup assertion. The public export does not include the issue-level recency, breadth, or exposure needed to say how widely that particular signature affects current development.
Example sanitized signature from the dominant editor path
UnrealEditor_ContentBrowserData!...FWriteAccessScope()
UnrealEditor_ContentBrowserData!UContentBrowserDataSubsystem::Initialize()
UnrealEditor_Engine!FSubsystemCollectionBase::AddAndInitializeSubsystem()
That changes the interpretation completely. The right conclusion is not "assertions are the crash type to fix first." The right next questions are: is this signature still present in the current build, how many developers or machines reproduce it, and does it block editor startup or merely occur on a recoverable path?
A broad crash category is orientation. Engineering priority starts one level lower, at the issue signature, with enough metadata around it to explain who and what it is affecting.
What Monday-Morning Crash Triage Should Actually Look Like
A useful crash queue should make the following questions easy to answer in order. If the tooling cannot answer one of them, the missing metadata is part of the triage problem.
A practical path from raw crash events to a priority order the engineering team can defend.
-
Which environment is it in?
Editor, packaged client, dedicated server, and live failures belong in separate operational queues.
-
Are these events one issue or many?
Group by fingerprint/signature before assigning work.
-
Is it new or still present in the current build?
Current regressions get looked at before a year of historical volume dominates the screen.
-
How broadly does it reproduce?
Look across builds, platforms, machines, users, or sessions instead of event count alone. -
How much was that environment exercised?
Normalize by sessions, testers, playtime, or test hours where a denominator exists. -
What does one occurrence cost?
Developer blocker, QA blocker, match-ending server failure, recoverable error, or player-session loss. -
Is there enough context to reproduce it?
Build, platform, symbolicated stack, logs, hardware, driver, and pre-crash state reduce the time spent reconstructing the failure. -
Then rank the queue.
Frequency still matters, but now it is one signal inside a decision the team can explain.
What a Triage-Ready Crash Issue Should Contain
Once the queue is filtered and ranked, the issue that enters engineering work should carry enough context to explain why it is there. A triaged crash can look something like this:
Illustrative triaged crash issue
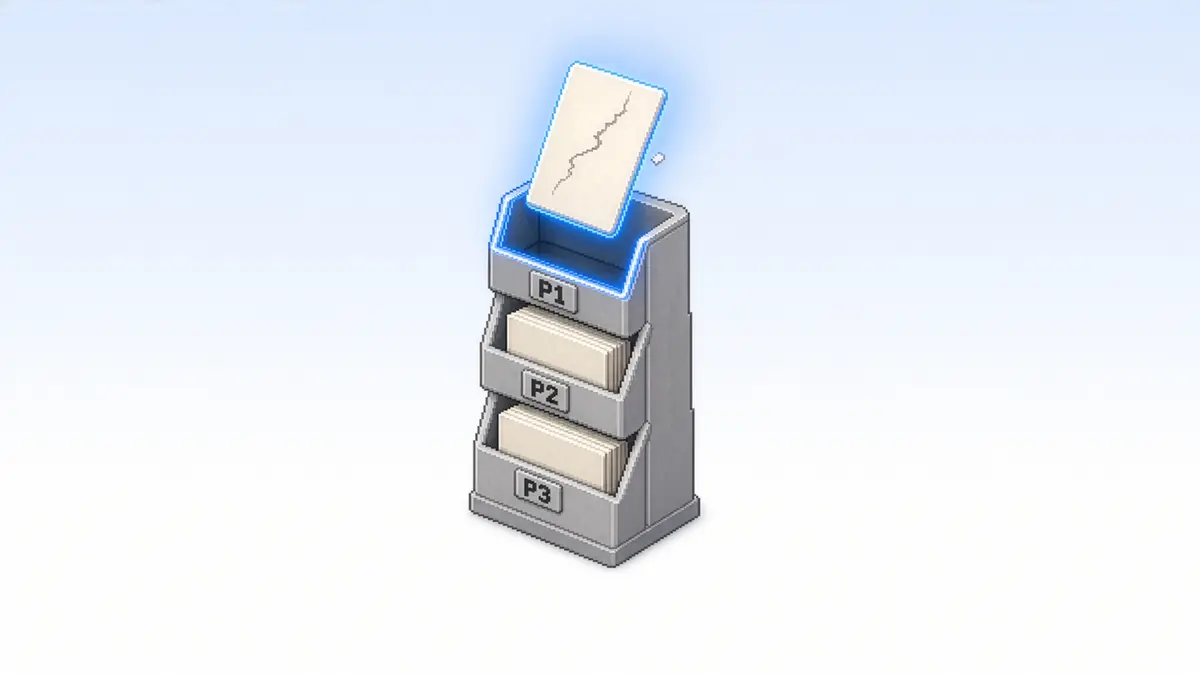
Priority: P1
Environment: Dedicated server
Introduced: build 1.4.82
Breadth: 7 instances / 3 regions
Rate: 2.1 crashes per 1,000 matches
Impact: active match terminated
Repro: intermittent
Context: symbolicated stack + logs available
Owner: server team
Illustrative example only - these values are not from the ADT dataset.
If Crash Dashboard Can't Answer These Questions, Collect the Missing Context
If the tooling cannot answer whether an issue is new, widespread, persistent across builds, or high-rate relative to exposure, that is not just a reporting gap. It tells the team which metadata the crash pipeline needs next.
-
Need to know whether this build regressed?
Capture issue-level first seen, last seen, build introduced, and a normalized crash rate by build. -
Need to know whether the problem is widespread?
Keep privacy-safe affected-machine, affected-user, or affected-session breadth. -
Need to know whether the same crash survives release after release?
Track issue persistence across build versions. -
Need to compare platform stability?
Preserve the session, playtime, or test-hour denominator alongside the crash count. -
Need to know whether one signature is swallowing a category?
Track top-issue concentration and recurrence buckets rather than relying on a category total.
Crash Volume Tells You What Is Loud. Triage Determines What Matters.
If the current crash workflow is one long list sorted by frequency, make two changes first: split the queue by environment, then filter it to issues still present in the current build. Those two changes alone usually produce a more useful engineering list than a year of raw event totals.
From there, add breadth, exposure, and impact. A crash that is current, widespread, and destructive belongs ahead of one that is historically noisy but narrow or already gone.
Put the context next to your crashes
Crash counts tell you something broke. Fixing it gets much easier when the issue already has the build, platform, symbolicated stack, logs, session details, and pre-crash context attached. AccelByte Development Toolkit groups related crash events into issues so your team can triage the problem with the evidence in front of them instead of reconstructing it afterward. ADT includes Crash Reporter in a 30-day free trial, so you can run your own builds through it and see how the workflow fits your team.
You're almost signed up!
Verify your account by following the instructions sent to .
If you still haven't received an email, please check your spam folder.
FAQ
An event is one observed crash occurrence. An issue groups events that appear to share the same underlying crash signature or fingerprint. In this dataset, 11,717 events were grouped into 4,000 distinct issues.
Because frequency does not tell you environment, recency, breadth, exposure, or impact. A noisy editor issue can generate more events than a lower-frequency regression that blocks a release candidate or terminates an active server session.
No. Every event in this export is marked as development, and there are zero live-production events.
No. Assertion / Check Failure represents 83.07% of this specific development dataset, which is dominated by editor traffic and is heavily influenced by a recurring editor-startup signature. It is not an industry or Shipping-build benchmark.
Because the export does not include an exposure denominator such as sessions, users, testing hours, or playtime for each platform.
Featured Blog Posts


Featured Customer Stories



Bring your first player online today.
Get started for free, and scale as your game grows.